Behind the Scenes of the Pacific Data Expedition
Back to updatesThanks���ٴ���repeated��and��dedicated research missions, as well as a structured research program throughout our offshore cleanup operations, we have been able to grow a dataset spanning close to a decade and covering��a significant proportion of the Great��Pacific Garbage Patch (GPGP)��– giving us valuable information about��its��size, composition, movement, and��behavior.��
By Helen Wolter and Peter��Puskic
One thing that has become increasingly clear with the increase in data collection is that the��GPGP��has been��changing��size and location��over��the��years.����Our existing dataset on floating plastics in the area is extensive, yet not exhaustive, as our understanding of the origin, transport, and fate of this pollution is restricted to regions we have covered by boat.��To achieve greater coverage,��we needed��a��new��data expedition to the GPGP.��
The Pacific Data Expedition
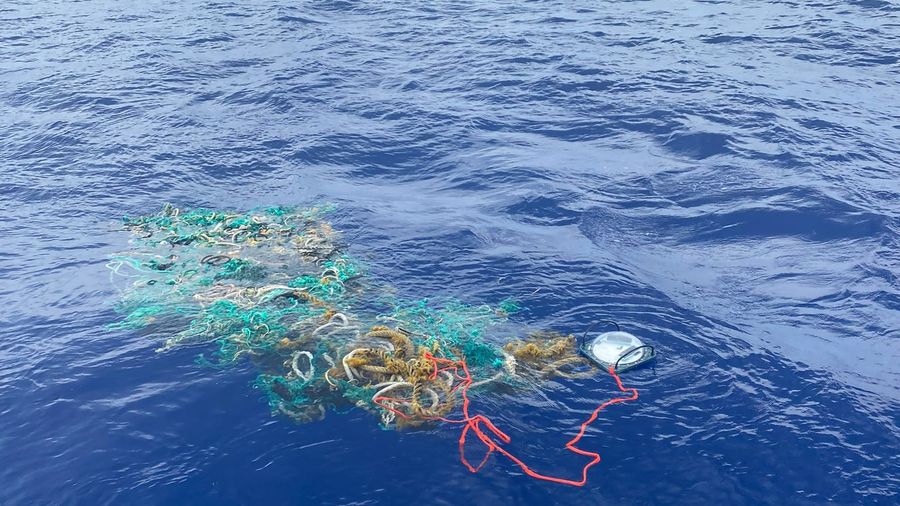
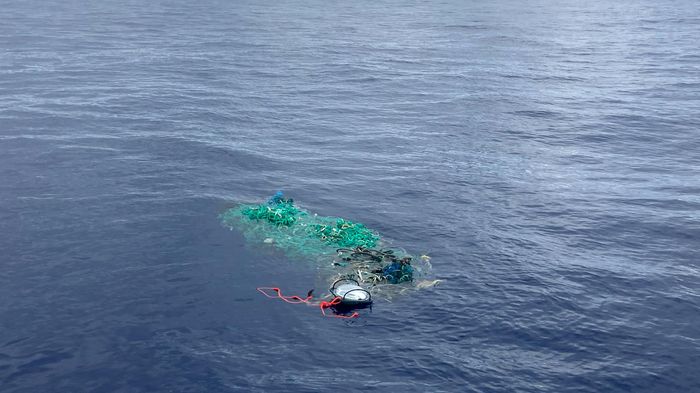
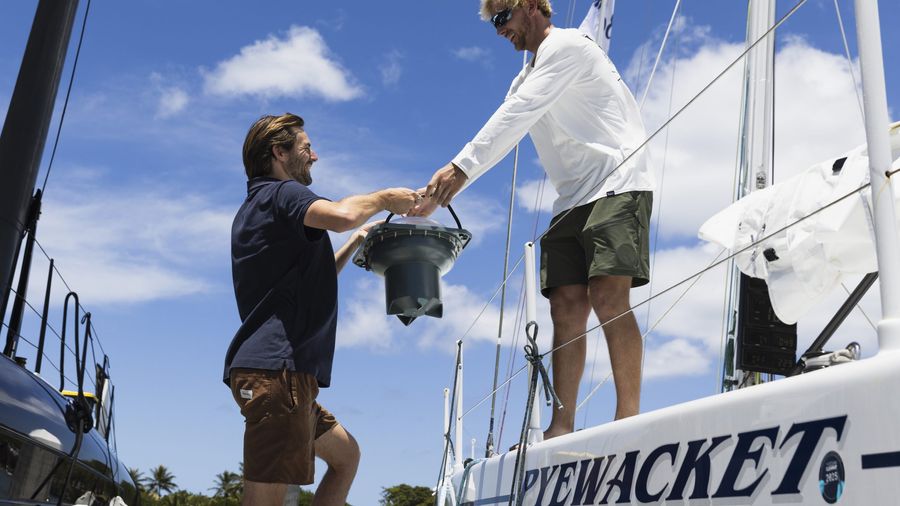
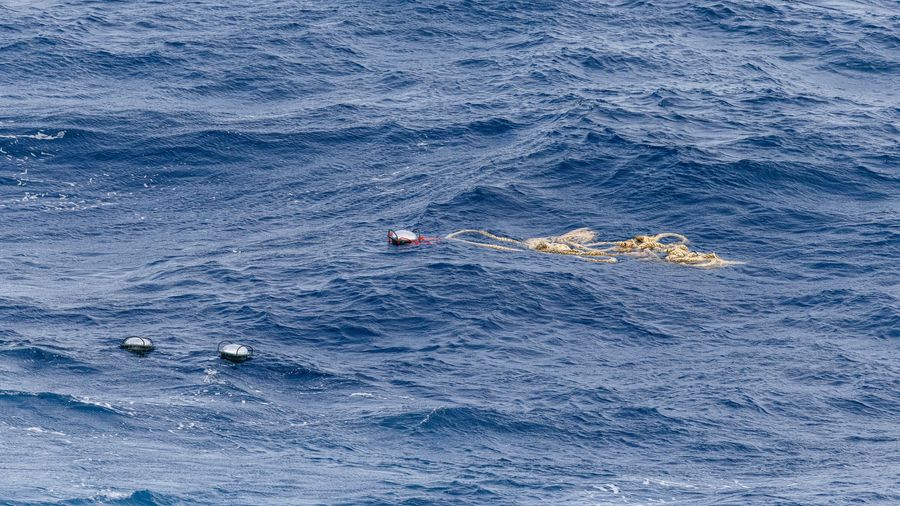
To support our��data-collection��efforts,��we��connected��with��citizen scientist sailors��participating��in the��Transpacific Yacht Race, sailing from��Los Angeles��to Honolulu��who��helped deploy��GPS drifter buoys attached to��ghost��nets��–��large tangles of abandoned, lost, or discarded fishing nets.��These tagged nets would continue floating, transforming, and accumulating, all while transmitting��valuable��data on their location in the ocean and helping us create a map of their trajectories around the GPGP.����
We are incredibly grateful for the dedication of these sailors, thanks to whom��17��ghost nets were tagged, and��55��drifters tracking ocean currents were deployed.��This��was��the first part of our Pacific Data Expedition.��To��be confident in our predictions of where we would find��ghost��nets, we needed to be sure that what our data was telling us was representative of the overall system.��
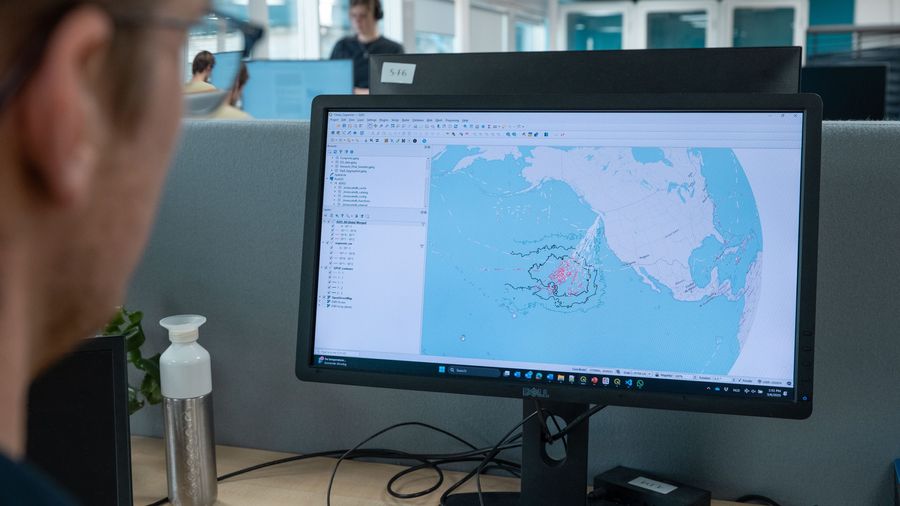
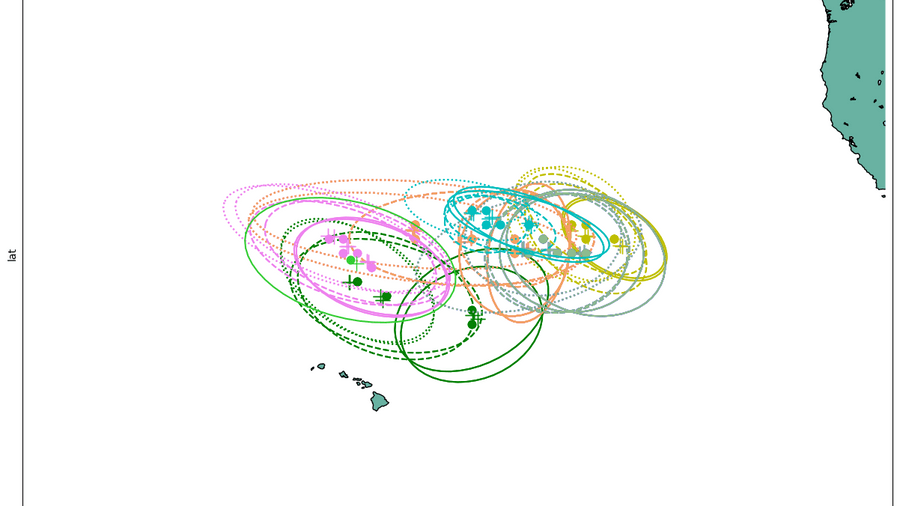
Using maps that were derived from multiple current circulation models of the��GPGP, we could see that we had covered a good portion of the Western side of the gyre; yet the area where the maps��diverged��(i.e., the current circulation models disagreed on where plastic was accumulating) was as of yet uncovered by our drifters.��To complement��our database and��the work of the��Transpac��sailors,��the second part of our��Pacific Data Expedition��would��need to��cover the Eastern section of the��GPGP.��
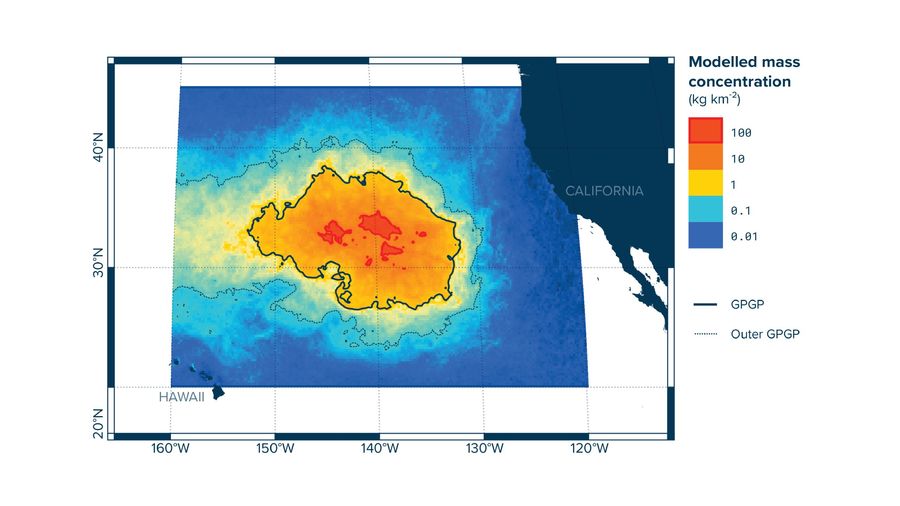
This map visualizes the various models that predict the GPGP’s location, and is informed by oceanographic data (e.g., currents).��The movements of��GPS drifters��will help us to understand which model is most��accurate, while the tagged nets help us understand how nets move in relation to ocean currents and wind, as they differ from typical floating plastics like buoys or plastic crates.
Back in the Garbage Patch��
If we were going to sail��six��days from Hawaii into the open ocean, we needed to ensure that the equipment we were deploying would give us the data that can help answer our mission-critical questions. We chose to increase the number of drifters to deploy, to increase the resolution of our coverage���ٴ���get a better picture of the fine-scale processes affecting marine debris, and to ensure that the data was reliable.����
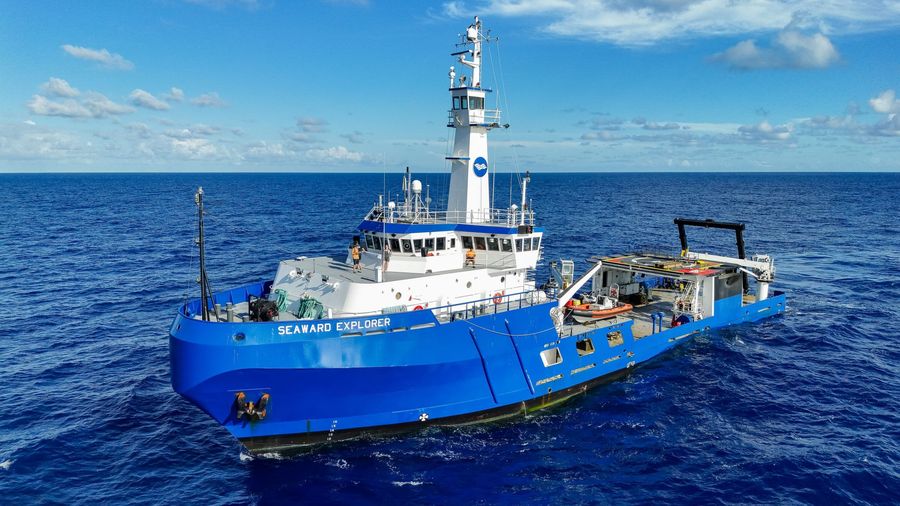
Aside from deploying the free-floating drifters, we wanted to take advantage of the high vantage point offered by a more traditional research vessel. We could��not��ask our citizen scientists to stand atop their masts, scouring the sea surface for nets to tag, but with our own chartered ship,��crew, and a “tuna tower” whose sole purpose is to provide a bird’s eye view on the ocean, our chances for spotting a net worth tagging dramatically increased.����
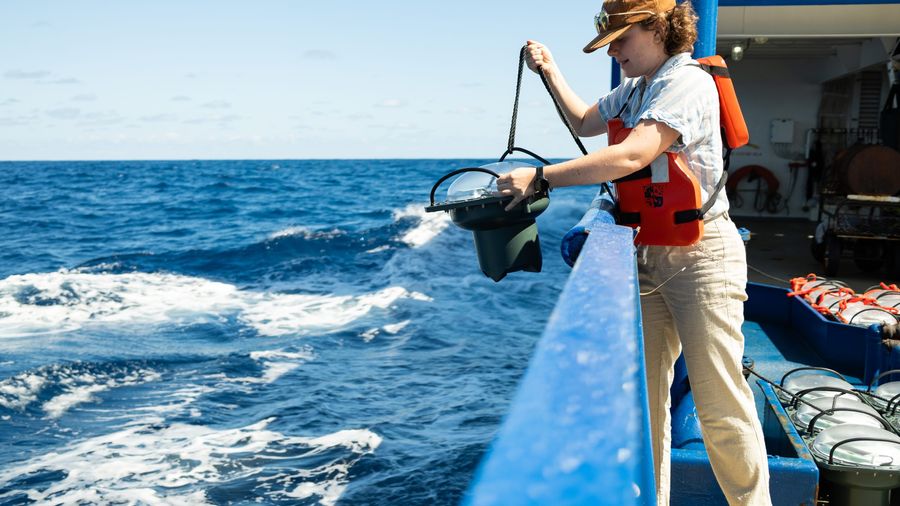
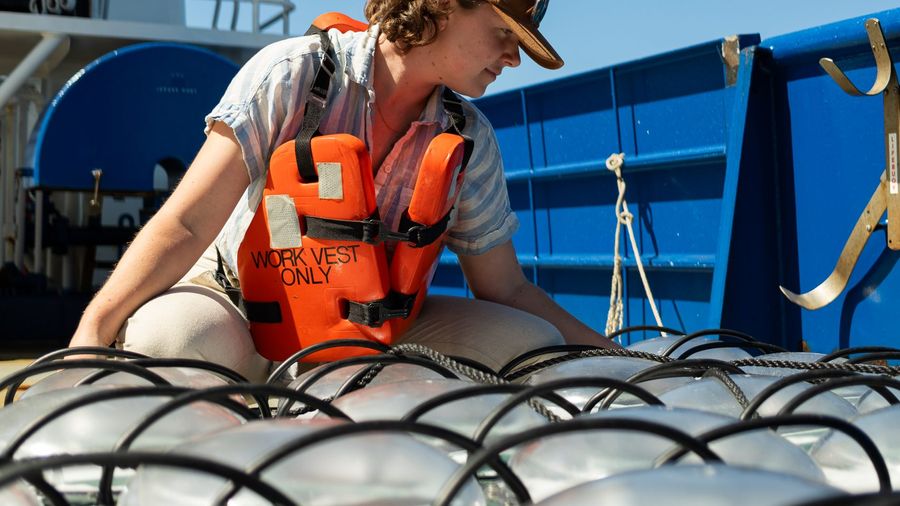
Armed with binoculars, radios and 144 of our trusted drifters, we headed out to the gyre, to collect the data that would complete our moving map of the GPGP. We stood watch in the tuna tower of the��Seaward Explorer, keeping our gaze on the waters around us, and shouted down whenever we saw something blue-green bobbing slightly below the surface.��
The challenge with��ghost��nets��is, unlike hard plastic such as crates and buoys, their center of mass tends to sit below the water surface, and their coloring is often close to that of the sea around them, making them all the more difficult to detect in a background of blue that is constantly in motion. Nevertheless, our keen collective eye paid off, and we tagged 10 nets along our route as we deployed freely floating drifters in the previously uncovered��portion��of the patch.����
Continuous Data-Collection��
Five��months on��from our Pacific Data Expedition, our drifters are still happily sending us updates on their journey through the patch. These updates, aggregated over time, are helping to paint a picture of how floating plastic, affected by larger and smaller-scale physical processes in the ocean, collectively creates the accumulation zone of floating debris that we are cleaning up.����
Similar to the processes affecting our drifters, the benefits we gain from such deployments range from global to local; by cross-validating existing models with field data, we are contributing to the understanding of��how the gyre changes and moves over time��and by linking each individual drifter to the smaller-scale currents and wind patterns that propel them, we can recognize patterns in drifter behavior as a result of these processes.����
Not only will this continuous collection show us the boundaries of the Garbage Patch, but it will show us how��individual��debris collects on a scale that is more reasonable to clean up.��